Debug & inspect · beta · Neovim 0.11+ · 338 commits
runtime-analysis.nvim
Runtime truth for a Neovim project: what actually ran, not what the source says. An in-editor HTTP request runner, opt-in call counting for any Lua plugin, a live read of what is really in package.loaded, stall detection that finds what blocks the main loop — including during startup, where --startuptime and :profile both give up — and a startup profiler that runs --startuptime enough times for its numbers to survive being read.
demos/runtime-analysis.tape in a clean Neovim — re-recorded weekly
what is shown when
- :RA inspect - a live package.loaded table, rendered
- :RA usage - which commands and keys you actually use
Connections
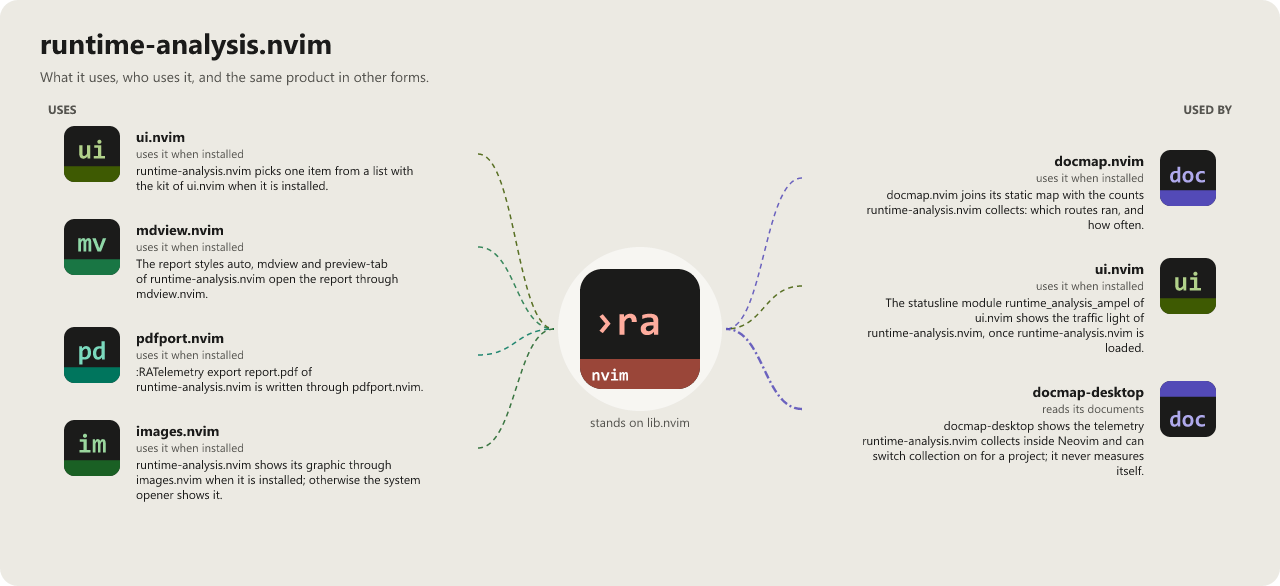
Tap the picture to open it at full size.
Install
{
  "WKDSteve/runtime-analysis.nvim",
  opts = {},
}
Beta stage — active development. This repository is past its first shape and in active use, but the surface is not frozen: breaking changes are still possible. Pin a commit or tag if you depend on it.
Documentation
Recent commits
- docs map: regenerate module map [skip ci]
- fix telemetry: compare outliers with the mean of the same calls
- feat telemetry: keep timing per day and a duration histogram
- docs map: regenerate module map [skip ci]
- fix telemetry: store functions without opts.dir use paths.dir()
- docs map: regenerate module map [skip ci]
- fix shape: never store a key name that is data, only count it
- test sheets: the http sheet checks the measured history fields and :RA traffic
Combos
- Statusline segments
Each contributes one optional segment to ui.nvim's statusline -- none is a dependency, the segment is simply absent without it.
ui.nvim , filetree.nvim , github_stats.nvim , recommender.nvim , sessions.nvim , sandbox.nvim
- Diagnostics neighbors
Related, not interchangeable -- each answers a different "what's going on" question (the editor, the program, the codebase, over time).